Calculating Degree of Saturation
Because it is necessary to calculate activity coefficients and extent of complexing for each substance that is present in significant amounts, the calculation of degree of approach to equilibrium (or to saturation for solids) requires the iterative solving of an extensive set of simultaneous equations. Several computer codes have been developed to do these calculations. Some examples:
MINTEQ – originally developed by USEPA, now maintained at KTH in Stockholm -- https://vminteq.lwr.kth.se/
see also MEDUSA for constructing diagrams.
https://www.kth.se/che/medusa/
PHREEQC – originally a main-frame FORTRAN program, has been developed over many years by the US Geological Survey. It can be used with many databases, including MINTEQs, which has a more extensive set of compounds of interest in drinking water research.
https://www.usgs.gov/software/phreeqc-version-3/
CHEAQS -Next is freeware for calculating speciation, equilibria, adsorption etc developed and supported by Wilko Verweij. It has an especially large database of organic ligands.
ORCHESTRA – is a speciation – reactive transport code that handles equilibrium reactions and a variety of kinetic expressions
EXAMPLE: Calculate the saturation state of drinking water with respect to the Pb carbonate cerussite/span>.
Below is the PHREEQC input file for this calculation for finished water from the treatment plant for Flint MI, assuming Pb to be at the action level of 15 ug/L.
Solution 1. Flint MI pre-change
units ppm
temp 11.6
pe 12
pH 7.38
Alkalinity 64 as Ca0.5(CO3)0.5
S(6) 28
Cl 34
Na 5
K 1
Ca 32
Mg 6
P 1 as PO4
Al 0.215
Fe 0.175
Pb 0.015
Mn 0.002
EQUILIBRIUM_PHASES
calcite
END
The final statement calculates the change in pH needed to bring the solution to saturation with respect to calcite, which in turn yields the value of the Langelier Index
In the output, we find the following concentrations and saturation values, to which is added a parallel set for Flint after the source water switch
PHREEQC model Flint MI |
|
|
|||||||
pH |
pHeq-cct |
Langelier |
Sicalcite |
Sicerussite |
Sihcerussite |
Larson-Skold Index |
Cl/SO4 mass ratio |
||
Flint MI |
pre-crisis |
7.38 |
8.09 |
-0.71 |
-0.83 |
-0.57 |
-2.18 |
1.16 |
1.21 |
Flint MI |
crisis peak |
8.07 |
7.92 |
0.16 |
0.17 |
-0.43 |
-1.09 |
2.06 |
2.50 |
The system showed only minor changes in the Langelier and Saturation indices. The water remained aggressive towards Pb carbonate minerals, although note that the Langlelier Index would not have predicted this result, only that the water came to equilibrium with calcite. The anion ratio indices are substantially higher however. From the Larson-Skold Index one would predict severe disruption of iron scales. The doubling of the CSMR along with the undersaturation of Pb carbonates would predict accelerated corrosion of lead service lines and leaded brass plumbing components.
One problem that Flint experienced was that water quality fluctuated severely on short time scales (days to weeks).
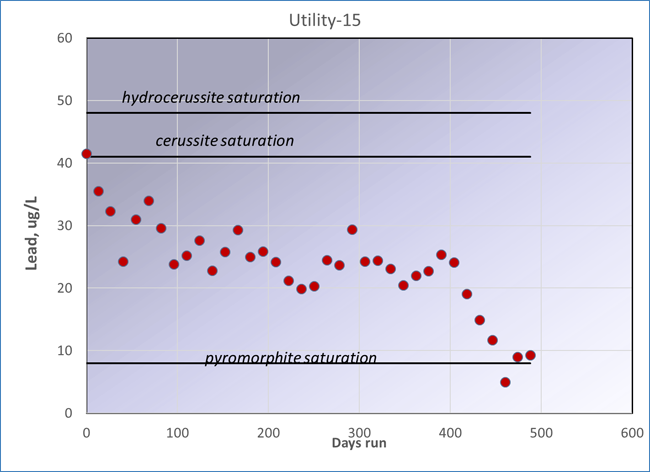
Shown below is a lead coupon experiment in another city that shows approach to equilibrium over a year + of exposure of the coupons to the distribution system water. Flow was stagnant for 22 hours and then on for 2 hours each day. It takes well over a year for a distribution system to adjust to significant changes in water source or treatment, in this case addition of a phosphate inhibitor.
